Data seasonality shapes every harvest cycle, driving critical decisions from seed selection to market timing. Just as nature follows predictable patterns of growth and dormancy, CSA farm data reveals recurring trends that smart farmers leverage for success.
Understanding these natural rhythms in your farm’s data unlocks powerful insights. Track weekly harvest volumes from previous seasons to predict future yields. Monitor temperature patterns alongside crop performance to optimize planting schedules. Map customer preferences across seasons to align crop planning with peak demand periods.
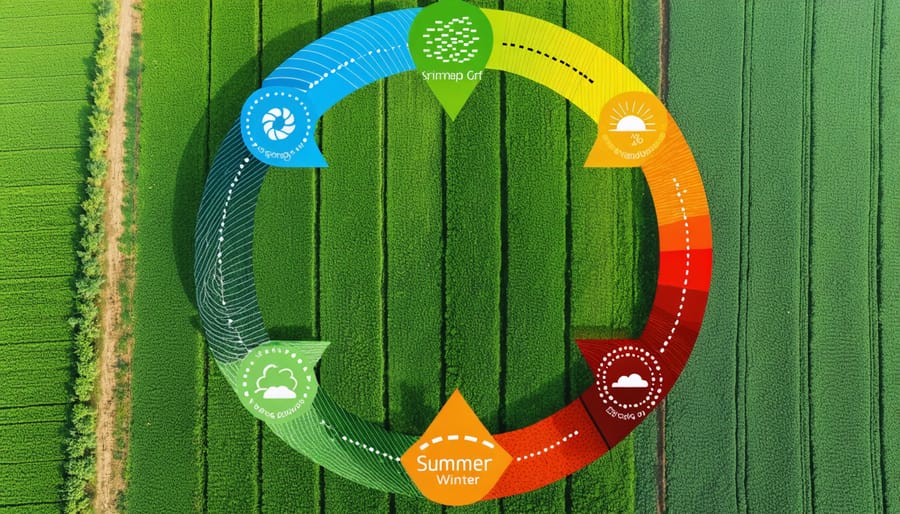
For CSA farmers, this seasonal intelligence transforms raw numbers into actionable strategy. Early spring seedling data predicts summer abundance. Summer harvest records forecast fall storage needs. Fall membership renewals indicate spring planting volumes. Each season’s data flows naturally into the next, creating a continuous cycle of informed decision-making that grows stronger year after year.
This practical approach to seasonal data empowers farmers to work in harmony with natural cycles while building more resilient and profitable operations.
Understanding Data Seasonality in Agriculture
Natural Cycles vs. Data Patterns
Just as nature follows predictable cycles of growth and dormancy, data patterns in farming often mirror these natural rhythms. Consider how tomatoes flourish in summer’s warmth while winter squash peaks in autumn – these natural growing seasons create corresponding patterns in harvest data, sales figures, and resource allocation.
For CSA farmers, understanding these cycles is crucial. Spring typically shows a surge in member signups, while late summer brings an abundance of produce variety and quantity. These patterns affect everything from labor needs to storage capacity planning.
Weather patterns, too, play a vital role in shaping data seasonality. Annual rainfall cycles, frost dates, and temperature patterns create predictable trends that smart farmers can use to their advantage. By tracking these natural cycles alongside their farm data, growers can better anticipate needs, optimize planting schedules, and improve crop planning efficiency.
Key Seasonal Data Points for CSA Farms
Successful CSA farms rely on several key data points that fluctuate with the seasons. Soil temperature and moisture levels serve as primary indicators for optimal planting times, while frost dates help determine both early spring and late fall harvesting windows. Growing degree days (GDD) track heat accumulation throughout the season, helping farmers predict crop maturity dates with greater accuracy.
Weather patterns, including rainfall and temperature trends, directly impact crop development and yield potential. Many CSA farmers maintain detailed records of germination rates, harvest quantities, and crop quality across different seasons to fine-tune their planning. Disease and pest pressure data often show seasonal patterns, allowing farmers to implement preventive measures at crucial times.
Customer preference data also follows seasonal trends, with certain crops gaining popularity during specific times of the year. Tracking these patterns helps farmers adjust planting schedules to meet member expectations while maintaining diverse crop offerings throughout the growing season.

Collecting Seasonal Farm Data
Essential Weather Metrics
Tracking weather patterns throughout the growing season is crucial for successful crop planning and yield prediction. Temperature variations, including daily highs and lows, help farmers anticipate frost risks and heat stress periods that could affect plant growth. Rainfall measurements give insights into natural irrigation patterns and help plan supplemental watering schedules.
Solar radiation levels influence photosynthesis rates and crop development, while humidity affects disease pressure and plant stress. Wind speed and direction data are essential for protecting crops and planning windbreak placement. Soil temperature readings, particularly in spring, guide optimal planting times for different crops.
Many successful CSA farmers maintain detailed weather logs, recording these metrics daily. Some use simple rain gauges and thermometers, while others invest in weather stations that automatically track multiple data points. By comparing current conditions with historical weather patterns, farmers can better predict harvest times and adjust their planting schedules.
Remember that local microclimates can create significant variations, so it’s important to collect data specific to your growing area rather than relying solely on regional forecasts.
Crop Performance Tracking
Monitoring crop performance throughout different seasons is essential for successful CSA farming. Start by establishing baseline measurements for each crop variety, including growth rates, yield patterns, and harvest timing. Keep detailed records using modern seasonal data analysis tools that can help track multiple variables like plant height, fruit development, and overall health.
Create weekly photo documentation of your crops, noting any significant changes or challenges. This visual record becomes invaluable when planning future growing seasons. Record weather patterns alongside crop development to identify correlations between environmental conditions and plant performance.
Pay special attention to key growth stages: germination rates, flowering times, and fruit set periods. Note which varieties thrive in specific seasonal conditions and which may need additional support. Track harvest quantities and quality metrics to help refine crop selection and timing for upcoming seasons.
Consider using a simple scoring system (1-5) for different aspects of crop performance, making it easier to compare data across seasons and share insights with other CSA farmers in your network.
Making Predictions Work for Your CSA
Creating Reliable Forecasting Models
Building reliable forecasting models for your CSA farm starts with consistent data collection throughout your growing seasons. By tracking planting dates, harvest quantities, and weather patterns, you’ll develop a strong foundation for predicting future yields. The key is to maintain detailed records of how different crops perform as you work to maximize seasonal yields.
Start by creating a simple spreadsheet that tracks weekly harvest amounts for each crop. Include columns for weather conditions, temperature ranges, and any unusual events that might affect growth. After collecting data for at least two full growing seasons, you can begin identifying patterns and correlations.
Look for recurring trends in your data, such as peak harvest times for specific crops or how weather patterns affect yield. Pay special attention to crops that consistently over or underperform your expectations – these variations often reveal important seasonal patterns.
Consider using basic statistical tools to analyze your data. Moving averages can help smooth out short-term fluctuations and highlight longer-term trends. Many farmers find success using simple forecasting formulas that account for both historical performance and seasonal factors.
Remember that your model should be flexible enough to adapt to changing conditions. Review and update your predictions regularly, incorporating new data and adjusting for any shifts in weather patterns or growing conditions. This dynamic approach ensures your forecasting remains accurate and reliable throughout the seasons.
Adjusting CSA Share Planning
Data-driven forecasting can revolutionize your CSA planning process, helping you create more balanced and satisfying share offerings throughout the season. By analyzing historical harvest data alongside weather patterns and member feedback, you can fine-tune your planting schedule and share contents to better meet member expectations.
Start by reviewing past seasons’ production data to identify peak harvest periods and potential gaps. This information helps you adjust crop varieties and planting dates to ensure consistent weekly shares. For example, if your data shows a consistent dip in produce variety during late July, you might introduce heat-tolerant crops or implement succession planting strategies to maintain diversity.
Many successful CSA farmers use simple spreadsheets to track their seasonal patterns, noting which crops performed well during specific weeks and adjusting their plans accordingly. Sarah Miller, a Vermont-based CSA farmer, increased member satisfaction by 40% after implementing data-based planning: “Looking at our harvest trends helped us realize we needed more early-season greens and late-summer root vegetables to balance our shares.”
Consider creating flexible share options based on your seasonal data. Some farms offer “peak season” shares during high-production months and “shoulder season” shares when variety might be limited. This transparency helps manage member expectations while maximizing farm efficiency and reducing waste.
Real Farm Success Stories
Green Acres CSA in Vermont transformed their operation by implementing data seasonality tracking in 2019. Owners Sarah and Mike Thompson noticed they were consistently overplanting certain crops while falling short on others. By analyzing three years of their sales data, they identified clear patterns in customer preferences across seasons. This led them to adjust their crop planning, resulting in a 30% reduction in waste and a 25% increase in member satisfaction.
In California, Desert Sun Farm’s journey with data seasonality began when they started losing members due to unpredictable harvest quantities. Owner Maria Rodriguez implemented a simple spreadsheet system to track weekly harvest yields alongside weather patterns. After two growing seasons, she could accurately predict harvest volumes within a 15% margin, allowing her to better manage member expectations and maintain consistent CSA box values throughout the year.
Perhaps the most inspiring story comes from Family Roots Farm in Ohio. The Andersons, a family of fourth-generation farmers, were struggling to compete with larger operations until they embraced data seasonality. They created detailed records of planting dates, harvest yields, and market demand patterns. This information helped them identify optimal planting windows for each crop and adjust their succession planting schedule. The result? Their CSA membership doubled in two years, and they now maintain a waiting list for new members.
These success stories share a common thread: starting small with basic data collection, maintaining consistent records, and using that information to make informed decisions about planting schedules and crop varieties. The farms’ experiences show that understanding data seasonality doesn’t require complex systems – just dedication to tracking and analyzing patterns over time.

Understanding and leveraging data seasonality is crucial for successful CSA farming operations. By tracking and analyzing seasonal patterns in your crop yields, member preferences, and market demands, you can make more informed decisions that benefit both your farm and your community.
Remember that successful data management isn’t just about collecting numbers – it’s about telling the story of your farm through the seasons and using that knowledge to grow sustainably. Start small by tracking basic metrics like weekly harvest quantities and member satisfaction, then gradually expand your data collection as you become more comfortable with the process.
Many successful CSA farmers have found that understanding their seasonal patterns has led to better crop planning, reduced waste, and more satisfied members. Take Sarah from Green Meadows Farm, who used three years of seasonal data to optimize her planting schedule and increase member retention by 30%.
Don’t wait for the perfect system – begin documenting your seasonal patterns today. Whether you use a simple spreadsheet or specialized farm management software, the insights you gain will prove invaluable for your farm’s future growth and sustainability. Your journey toward data-driven farming starts with that first seasonal observation.